
Why Inventory AI Deployments Fail at the Data Layer
The dominant failure mode in AI inventory optimization is not a bad algorithm. It is bad data fed into a capable algorithm — producing outputs that are confidently wrong at scale.
Approximately 70% of AI projects fail to move from pilot to production, according to a widely cited industry figure attributed to Virtasant and referenced in multiple practitioner sources. The root cause, consistently, is not model sophistication — it is a failure to assess and remediate the data environment before deployment begins. Supply chain operations experience this disproportionately because inventory AI draws on multiple source systems simultaneously — ERP, WMS, supplier portals, POS feeds — each with its own data quality profile and its own failure modes.
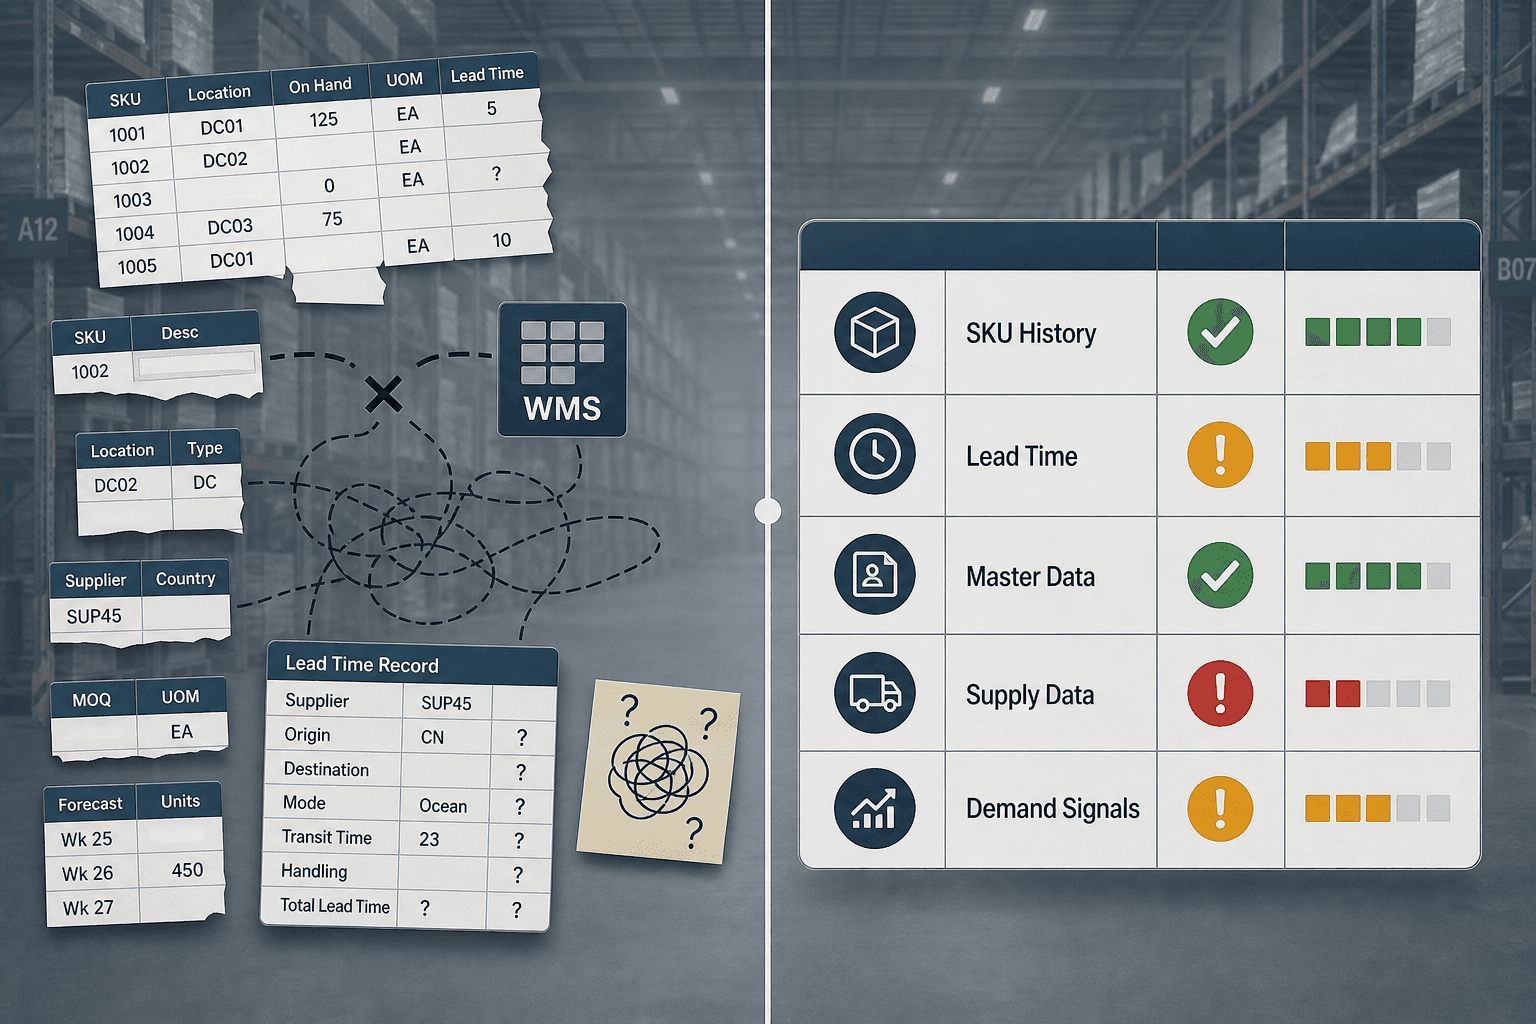
When an inventory optimization model ingests flawed data, it does not produce obviously wrong outputs. It produces plausible-looking reorder suggestions and safety stock levels that are systematically miscalibrated. The error compounds quietly: a static lead time field in the ERP causes the model to under-buffer against supplier variability; a UOM mismatch between ERP and WMS generates phantom on-hand quantities; duplicate SKU codes create redundant order signals. Each failure mode is invisible until the model has already driven inventory decisions in production.
Data quality drives an estimated 60–70% of AI effectiveness in inventory optimization contexts. Budget allocation reflects this: practitioners who have successfully deployed inventory AI consistently allocate 15–20% of total implementation cost to data preparation — before software licensing and integration spend. Organizations that skip this phase discover the same gaps mid-implementation, at a point when a vendor's implementation team is billing for remediation.
Why Generic AI Readiness Frameworks Are Insufficient for Inventory Optimization
Enterprise AI readiness frameworks — including Deloitte's AIDR five-dimension model (availability, volume/diversity, quality/integrity, governance, ethics/responsibility) and Microsoft's seven-pillar approach — are designed to assess organizational and infrastructure readiness for AI adoption broadly. They are useful for identifying data governance gaps, compliance exposure, and infrastructure prerequisites.
What they do not assess is the inventory-specific data quality that determines whether an inventory optimization model produces reliable outputs. Generic frameworks evaluate whether data exists and is governed; they do not evaluate whether the specific inputs that inventory AI models require are accurate, complete, and structured at the right granularity.
The inventory-specific inputs that generic frameworks miss include:
- Lead time variability capture at the supplier-SKU level — not just whether lead times are recorded, but whether historical actuals versus planned are tracked with variance metrics
- Safety stock calculation inputs — stockout cost estimates, holding cost parameters, and service level targets that feed probabilistic safety stock models
- ABC/XYZ classification data — velocity and variability segmentation that determines which SKUs are candidates for which optimization techniques
- Multi-echelon positioning records — inventory location data across distribution centers and points of sale required for network-level optimization
- Supplier reliability metrics — on-time delivery rates, fill rates, and lead time deviation history per supplier, which reinforcement learning models consume as continuous inputs
A team that passes a generic AI readiness assessment can still have every one of these inventory-specific dimensions in a blocking state. This is why an inventory-specific assessment framework is necessary before vendor selection or pilot commitment.
The Five Inventory-Specific Data Assessment Dimensions
The assessment framework in this guide is organized around five data dimensions that are specifically required for inventory optimization AI — and that are frequently incomplete, inaccurate, or absent when teams begin vendor evaluation.
| Dimension | Primary Failure Mode if Absent | AI Technique Most Affected |
|---|---|---|
| SKU Transaction History | Model underfits seasonal patterns; reorder point calculations lack statistical basis | Probabilistic forecasting, gradient boosting for demand modeling |
| Lead Time Data | Safety stock systematically under-buffered; reorder points calibrated to static assumptions rather than actual variability | LSTM safety stock models, stochastic optimization |
| Master Data Integrity | Duplicate SKUs generate phantom demand; UOM mismatches produce phantom inventory; stale lead time fields corrupt all downstream calculations | All inventory optimization techniques |
| Supply-Side Data | Reinforcement learning models cannot optimize ordering costs without MOQ, storage cost, and supplier reliability inputs | Reinforcement learning, multi-echelon optimization |
| Demand Signal Coverage | Channel-level inventory positioning errors; promotional lift not isolated from baseline; returns inflate apparent demand | Multi-channel inventory optimization, probabilistic replenishment |
Dimension 1: SKU Transaction History — Depth, Completeness, and Granularity
Transaction history depth is the most frequently discussed inventory AI prerequisite, and also the most frequently misunderstood. The question is not simply whether historical data exists — it is whether the depth, completeness, and granularity are sufficient for the specific optimization technique being deployed.
Minimum viable thresholds vary by use case and model type, but the following ranges are consistent with practitioner guidance across multiple implementation contexts:
| Product Type / Use Case | Minimum History | Preferred Depth | Rationale |
|---|---|---|---|
| Non-seasonal, basic replenishment | 12 months | 18 months | Sufficient for stable demand pattern detection; 12 months captures one full cycle |
| Seasonal products | 24 months | 36+ months | Two full seasonal cycles required for reliable pattern separation from trend |
| Probabilistic optimization (safety stock, reorder points) | 18 months | 24 months | Variance estimation requires sufficient sample size across demand states |
| New SKUs / sparse history | External signal augmentation required | N/A | Model cannot generalize from <6 months of data; requires attribute-based or similar-SKU transfer approaches |
Granularity matters as much as depth. Daily or weekly SKU-level transaction records are the minimum granularity for ML-based inventory optimization. Monthly aggregates are insufficient — they eliminate the demand variability signal that safety stock and reorder point models are designed to capture.
Completeness gaps — missing periods, zero-sales records that represent stockouts rather than true zero demand, and system migration gaps — must be identified and documented before model training. A gap of two to four weeks in a twelve-month history is manageable with imputation; a gap of three months in a seasonal peak period is a blocking condition.
Dimension 2: Lead Time Data — Accuracy, Variability Capture, and Supplier-Level Coverage
Lead time data is the most underestimated prerequisite in inventory AI deployments. Teams that have invested in transaction history quality frequently discover, mid-pilot, that their lead time data is static, aggregated, and disconnected from actual supplier performance.
The problem is structural. Most ERP systems store a single planned lead time value per SKU-supplier combination — a field that may not have been updated since the supplier relationship was established. AI-calculated safety stock and reorder points depend on the actual mean and standard deviation of lead time per supplier-SKU pair, measured from historical purchase order receipt data. Static planning parameters produce static safety stock — the opposite of what dynamic inventory optimization is designed to deliver.
What adequate lead time data looks like in practice:
- Per-supplier-SKU records with both planned lead time and actual receipt date for each historical purchase order
- Sufficient purchase order history to calculate lead time mean and standard deviation — typically 20+ order cycles per supplier-SKU pair
- Timestamps at the line-item level, not just order-level, to capture partial shipment variability
- Supplier performance flags — on-time, early, late, partial — that allow the model to weight recent performance appropriately
The remediation path for static lead time fields typically involves extracting purchase order receipt history from the ERP's transactional tables — data that exists in most systems but is not surfaced in the planning parameter fields. This extraction is a data engineering task, not a data quality task, and should be scoped as part of the integration phase.
Dimension 3: Master Data Integrity — ERP/WMS Alignment and Inventory-Specific Fields
Master data integrity failures are the most expensive inventory AI blocking condition because they corrupt every downstream calculation. A duplicate SKU code does not produce a visible error — it produces two separate demand signals that the model treats as distinct items, generating redundant reorder suggestions and inflating apparent demand. A unit-of-measure mismatch between ERP and WMS does not produce a visible error — it produces phantom on-hand quantities that cause the model to treat in-stock items as stockouts.
The three master data failure modes that most frequently block inventory AI deployments are:
- Duplicate SKU codes: The same physical item represented under multiple codes across regions, vendor catalogs, or system migrations. AI deduplication can detect SKUs that exist under slightly different names or vendor codes, but the consolidation work must be completed before model training — not after. One documented enterprise data consolidation effort reduced 3.8 million records to 77,000 through AI-assisted deduplication, illustrating the scale of the problem in complex product catalogs.
- Unit-of-measure mismatches: ERP records inventory in cases; WMS records in eaches. Without a validated UOM conversion layer, the model receives conflicting on-hand signals from the two systems. This is particularly common in organizations that have implemented WMS separately from ERP without a formal master data alignment project.
- Stale supplier lead time fields: Planning parameter fields in ERP that have not been updated since initial system configuration, or that reflect negotiated lead times rather than actual historical performance. These fields feed directly into reorder point calculations in most ERP systems, and their values propagate into AI models unless explicitly overridden with historical actuals.
Poor data quality costs organizations an average of $12.9 million per year according to Gartner figures cited in practitioner literature. In inventory AI contexts, the cost is concentrated in two phases: the pilot phase, when data quality failures surface as model output anomalies, and the production phase, when undetected errors drive systematic inventory miscalibration.
Dimension 4: Supply-Side Data — Supplier Reliability, MOQ, and Cost Records
Supply-side data is the dimension most frequently absent from demand forecasting readiness assessments — and therefore the dimension most likely to be overlooked by teams who have completed a forecasting data audit and assume their inventory readiness is equivalent.
Reinforcement learning models for inventory optimization require a different input set than demand forecasting models. Where a forecasting model primarily needs demand history and external signals, an inventory optimization model needs the full cost structure of the inventory decision: what it costs to hold a unit, what it costs to be out of stock, what the minimum order quantity is, and how reliably each supplier delivers to the expected lead time.
The supply-side data inputs required for AI inventory optimization include:
- SKU-level supplier reliability metrics: on-time delivery rate, fill rate, and lead time deviation history per supplier — not aggregate supplier scorecards
- Minimum order quantity (MOQ) records per supplier-SKU combination, including any tiered pricing or volume discount structures
- Storage cost estimates per SKU or SKU category — holding cost as a percentage of unit cost, or explicit per-unit-per-period storage cost
- Stockout cost estimates — either explicit backorder cost records or a service-level-to-cost mapping that the model can use to calibrate safety stock targets
- Supplier performance history over a sufficient window — typically 12 months minimum — to allow the model to distinguish systematic reliability patterns from one-time disruption events
In most organizations, these inputs are distributed across procurement systems, supplier portals, finance systems, and spreadsheets. Consolidating them into a structured, SKU-supplier-level dataset is a data engineering task that should be scoped separately from the ERP and WMS integration work.
Dimension 5: Demand Signal Coverage — POS, Returns, Promotions, and Channel Separation
Demand signal coverage for inventory optimization is not the same as demand signal coverage for demand forecasting. The forecasting readiness question is whether sufficient history exists to build an accurate forward-looking demand model. The inventory optimization question is whether the demand signals are structured in a way that allows the model to position inventory correctly across channels, account for promotional distortion, and distinguish true demand from returns-inflated apparent demand.
The inventory-specific demand signal gaps that most frequently cause positioning errors are:
- POS data feed incompleteness: Retail or omnichannel operations where POS data feeds are delayed, aggregated above the SKU-location level, or missing entirely for a subset of channels. Inventory positioning models require sell-through data at the SKU-location level to distinguish where demand is occurring from where inventory is held.
- Returns data capture: Returns that are credited back to on-hand inventory without a corresponding demand offset create phantom inventory signals. In high-return-rate categories (apparel, consumer electronics), unhandled returns data causes the model to systematically over-estimate available inventory and under-replenish.
- Promotional event tagging: Promotional lift embedded in historical transaction records without event flags causes the model to treat promotional demand as baseline demand, resulting in inflated safety stock targets for non-promotional periods and insufficient buffer ahead of promotions.
- Channel separation: Multi-channel inventory models require demand signals separated by fulfillment channel — D2C, wholesale, marketplace, retail — because inventory positioning logic differs by channel. Aggregated demand history prevents the model from optimizing channel-level inventory placement.
Scoring Each Dimension: A Practical Rating Methodology
Each of the five dimensions should be rated on a 1–5 maturity scale. Level 3 is the minimum threshold for pilot-to-production transition. Dimensions scoring below Level 3 require remediation before pilot commitment; dimensions scoring at Level 3 or above can proceed, with Level 4 and 5 gaps addressed in parallel with vendor selection or early pilot work.
| Level | Label | Description | Deployment Implication |
|---|---|---|---|
| 1 | Absent | Data does not exist in structured form, or exists only in spreadsheets/paper records with no extraction path | Blocking — pilot commitment not appropriate until Level 3 achieved |
| 2 | Partial | Data exists in source systems but has significant gaps: missing periods, wrong granularity, no variance capture, or unresolved duplicates | Blocking — remediation timeline must be established before vendor selection |
| 3 | Developing | Data meets minimum viable thresholds: sufficient depth, daily/weekly granularity, <5% missing records, basic supplier-level coverage | Minimum pilot threshold — proceed with documented gap remediation plan |
| 4 | Adequate | Data meets preferred thresholds: 24+ months history, per-supplier-SKU lead time actuals, UOM consistency validated, promotional flags present | Proceed — addressable gaps may be resolved in parallel with pilot |
| 5 | Optimized | Data exceeds minimum thresholds, is continuously maintained, and has documented lineage and validation processes | Full production deployment appropriate |
Blocking gaps are those where the missing or corrupted data directly determines model output quality for the core optimization objective. Addressable gaps are those where the model can produce useful outputs without the data, but with reduced precision or coverage. The distinction matters for sequencing: blocking gaps must be resolved before the pilot begins; addressable gaps can be remediated during the pilot period without invalidating initial model outputs.
A radar chart plotting the five dimension scores against the Level 3 threshold line is the most effective visualization for surfacing the lowest-scoring dimensions at a glance and communicating the readiness profile to senior stakeholders who are not involved in the data assessment work.
Remediation Sequencing: What to Fix First and Why
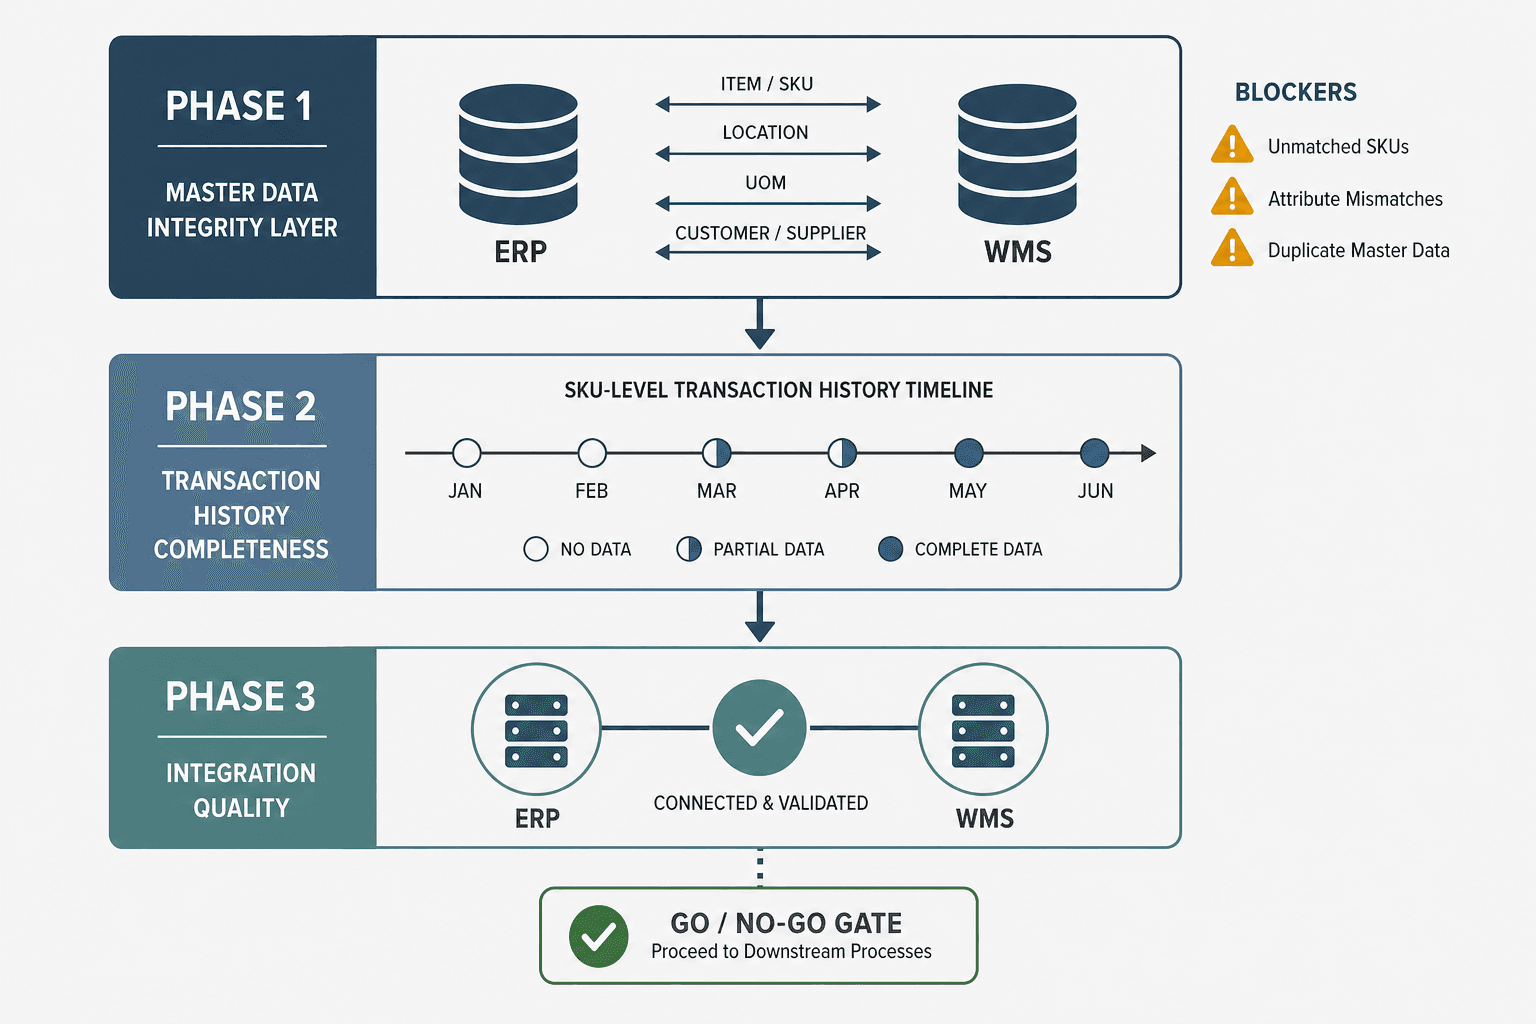
The order in which data gaps are remediated matters as much as the remediation itself. The correct sequence is: master data first, then transaction history completeness, then integration quality. This sequence is not arbitrary — it reflects a dependency structure that, if ignored, forces rework.
Master data errors corrupt downstream transaction records at scale. A duplicate SKU code that exists during the transaction history period means that every historical transaction for that item is split across two codes. If you remediate transaction history completeness before resolving the duplicate, you will need to re-clean the consolidated transaction records after the duplicate is merged. The same logic applies to UOM mismatches: correcting the UOM conversion layer after transaction history remediation requires recalculating all historical on-hand and receipt quantities.
| Phase | Remediation Focus | Prerequisite For | Estimated Effort Share |
|---|---|---|---|
| Phase 1 | Master data: duplicate SKU resolution, UOM standardization, ERP/WMS field alignment | All subsequent phases — master data errors propagate into transaction and integration layers | 40–50% of data preparation effort |
| Phase 2 | Transaction history: gap filling, stockout period flagging, promotional event tagging, granularity standardization | Model training data quality — cannot train on corrupted or incomplete history | 30–35% of data preparation effort |
| Phase 3 | Integration quality: lead time actuals extraction, supplier reliability data consolidation, POS feed validation, channel separation | Model input pipeline — ensures live data feeds match the quality of training data | 20–25% of data preparation effort |
The 15–20% data preparation budget allocation is a practitioner-validated range, not a theoretical recommendation. Teams that allocate less typically discover the shortfall when implementation timelines extend to accommodate mid-project data remediation — at significantly higher cost per hour than pre-project remediation.
Common Inventory AI Data Failure Patterns
The following failure patterns recur across inventory AI deployments with sufficient regularity to be treated as expected risks rather than edge cases. Each has a specific mechanism that distinguishes it from generic data quality warnings.
- Lead time inaccuracy compounding into safety stock errors: When the ERP's lead time planning field is used as the model input rather than historical actuals, the model calculates safety stock based on an assumed lead time distribution that does not match reality. If the static field understates actual lead time by 20%, the model systematically under-buffers every SKU sourced from that supplier. The error is invisible in model outputs — safety stock levels look reasonable — but surfaces as stockouts during periods of normal supplier variability.
- UOM mismatches generating phantom inventory signals: ERP records on-hand inventory in cases; WMS records in eaches; the conversion factor is missing or incorrect in the integration layer. The model receives an on-hand signal that is 12x or 24x the actual unit count. It responds by suppressing reorder signals for items that are actually at or below safety stock. The failure mode is stockouts on items the model believes are well-stocked.
- Duplicate SKUs creating phantom demand signals: The same physical item exists under two or more SKU codes — often the result of a system migration, a regional naming convention difference, or a vendor catalog update. The model treats each code as a distinct item. Historical demand is split across codes, making each appear to have lower velocity than it does. The model generates separate reorder suggestions for each code, resulting in redundant orders and inflated inventory.
- Missing supplier-level lead time variance records preventing dynamic safety stock adjustment: AI safety stock models are designed to adjust buffer levels in response to changes in supplier reliability — if a supplier begins delivering late consistently, the model should increase safety stock for affected SKUs. This adjustment requires a continuous stream of actual versus planned delivery data at the supplier-SKU level. Without it, the model cannot detect the reliability shift and safety stock remains calibrated to historical performance that no longer reflects current supplier behavior.
Go/No-Go Deployment Checklist
The following checklist defines the minimum conditions that must be met before committing to a vendor selection or pilot deployment. These are pre-vendor-selection gates, not post-selection remediation items. A team that cannot confirm each condition should complete the relevant remediation phase before engaging vendor implementation resources.
| Dimension | Go Condition | Blocking if Not Met? | Notes |
|---|---|---|---|
| SKU Transaction History | Minimum 18 months of SKU-level daily or weekly transaction data with <5% missing records; 24+ months for seasonal products | Yes | Stockout-period zeros must be flagged before model training |
| Lead Time Data | Per-supplier-SKU historical actuals (planned vs. received) available for 20+ order cycles; lead time mean and standard deviation calculable | Yes | Static ERP lead time planning fields are not a substitute for historical actuals |
| Master Data — UOM | Unit-of-measure consistency >95% between ERP and WMS, validated by a record-level reconciliation, not a field-level audit | Yes | UOM mismatches below 5% may be addressable in parallel with pilot if documented |
| Master Data — Duplicate SKUs | No unresolved duplicate SKU codes in the item master; deduplication validated against both ERP and WMS item catalogs | Yes | AI-assisted deduplication is acceptable; manual review of merged records required before model training |
| Master Data — Lead Time Fields | ERP lead time planning fields reconciled against historical actuals; stale fields updated or overridden in the data pipeline | Yes | Stale fields that have not been updated in >12 months should be treated as absent, not as valid inputs |
| Supply-Side Data | SKU-level MOQ records, storage cost estimates, and supplier on-time delivery rates available for primary suppliers covering >80% of inventory value | Conditional | Blocking for reinforcement learning models; addressable for simpler probabilistic replenishment approaches |
| Demand Signal Coverage | POS or order data available at daily or weekly granularity; promotional event flags present in transaction history; returns data separated from forward demand | Conditional | Blocking for multi-channel inventory positioning; addressable for single-channel replenishment pilots |
| Data Lineage | Each data input can be traced to a source system with a documented extraction path and refresh cadence | No | Addressable in parallel with pilot, but must be resolved before production deployment |
Teams that complete this assessment before vendor engagement consistently avoid the most expensive failure mode in inventory AI: discovering blocking data gaps during implementation, when vendor resources are engaged and the remediation cost is highest. The assessment itself — conducted systematically against these five dimensions — is the single highest-leverage action available before committing to a deployment timeline.
Comments
Join the discussion with an anonymous comment.