Why Most AI Freight Procurement Pilots Stall Before Delivering Value
The commercial pressure to deploy AI in freight procurement has never been more acute. Truckload spot rates climbed 16.5% year-over-year in Q1 2026 — the highest reading since Q3 2021 — and RXO's data suggests Q2 2026 is on pace to exceed that mark. National tender rejection rates have surpassed 14%, meaning roughly one in seven loads is being turned back by carriers who prefer spot market margins over contracted commitments. Meanwhile, federal regulatory enforcement is structurally shrinking the available carrier pool.
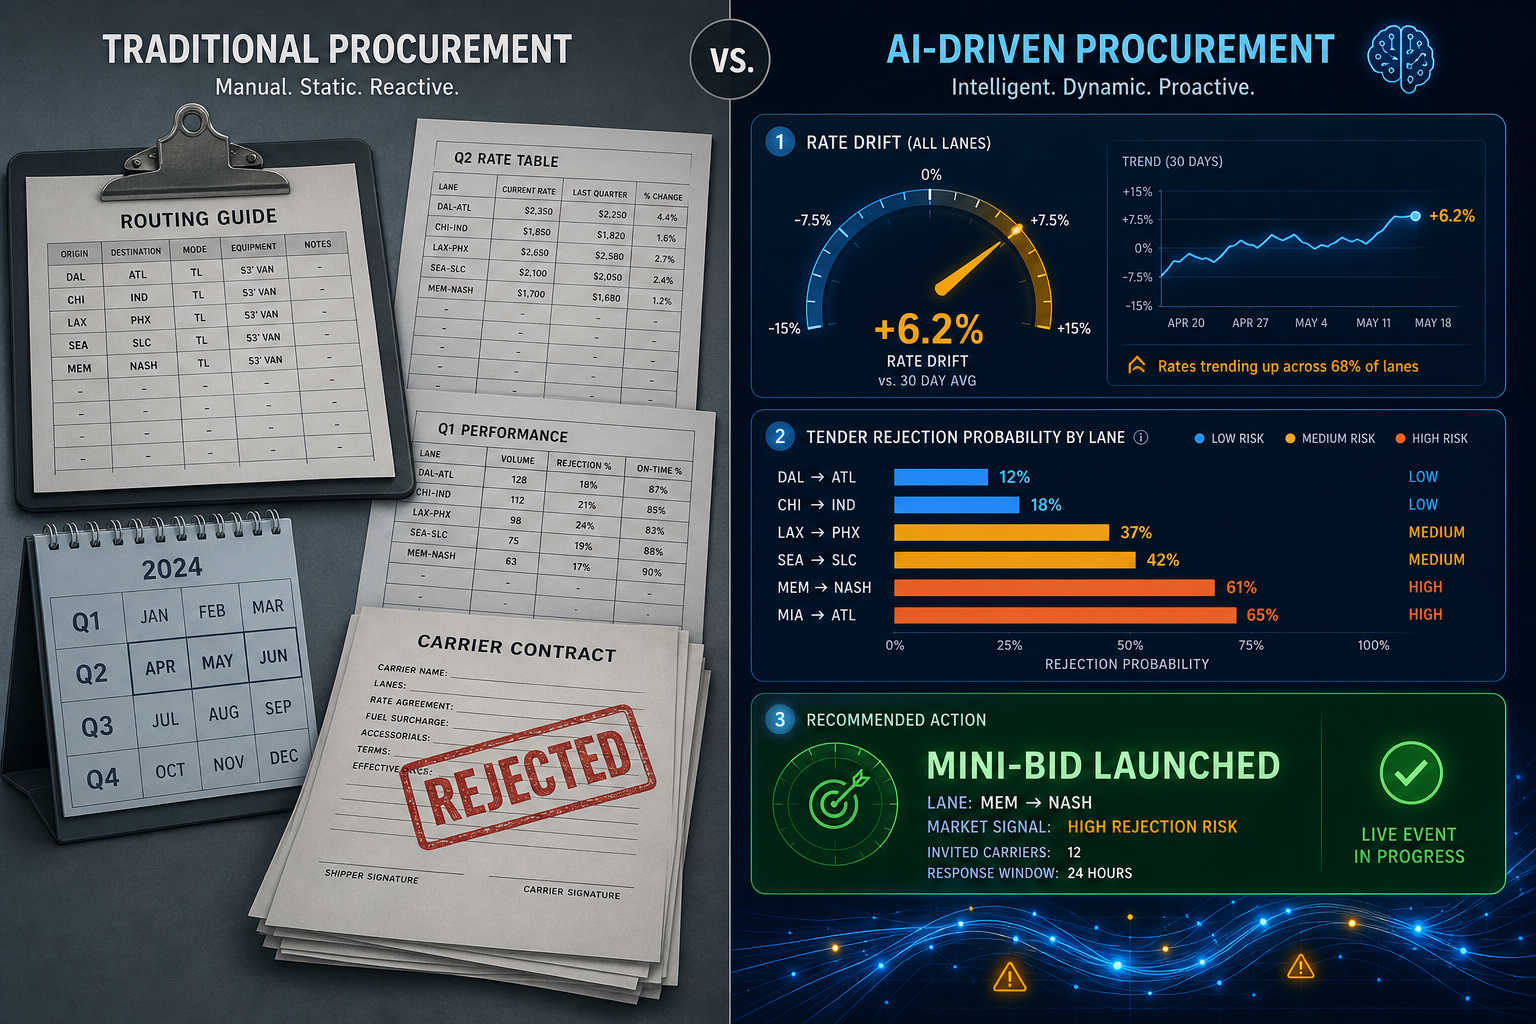
Against that backdrop, AI-enabled freight procurement tools are being marketed as the solution. Many transportation directors are under pressure to deploy something quickly. That urgency is understandable — and it is also precisely why so many pilots stall before delivering measurable value.
The failure mode is rarely a flawed model. It is a skipped prerequisite. Legacy TMS platforms were built for execution, not procurement intelligence. They rely on static inputs — annual bid data, fixed routing guides, historical carrier relationships — and surface procurement problems only after those problems have already appeared in operational data. Layering an AI model on top of a system that was never designed to feed it the right signals produces the same result as building a precision instrument on a shaky foundation: impressive on paper, unreliable in production.
This guide is structured around what procurement teams must do before, during, and after deploying AI rate prediction and tender rejection models — not which vendors offer what capabilities. The goal is to give transportation directors and freight procurement leads a clear-eyed view of the prerequisites so they can assess their readiness honestly before committing to a deployment path.

Rate Prediction and Rejection Modeling Are Not the Same Problem
One of the most common deployment mistakes is treating AI freight rate prediction and tender rejection modeling as variations of the same tool. They are not. They answer different questions, require different input features, and produce different procurement outputs. Conflating them leads to mismatched data pipelines, degraded model accuracy, and procurement teams acting on signals the model was never designed to generate.
Rate prediction models answer: Is our contracted rate on this lane above or below what the market would bear today? Their primary inputs are lane-level contracted rate history benchmarked against live market rate feeds. The model needs to know what you paid, what the market is paying now, and how that gap has moved over time.
Tender rejection models answer: Which carriers on which lanes are likely to reject our next tender, and how exposed are we if they do? Their primary inputs are carrier-specific acceptance and rejection histories by lane, real-time Outbound Tender Rejection Index (OTRI) feeds, and the spread between contracted and spot rates on that lane. A carrier who has been accepting tenders at 94% over the past six months but whose acceptance rate has dropped to 78% over the past four weeks is a rejection risk signal that has nothing to do with whether your contracted rate is above market.
| Dimension | Rate Prediction Model | Tender Rejection Model |
|---|---|---|
| Core question | Is our contracted rate above or below market? | Which carriers on which lanes are likely to reject? |
| Primary data inputs | Lane-level contracted rate history, live market rate feeds | Carrier acceptance/rejection history by lane, OTRI feeds, spot-contract spread |
| Signal type | Rate drift from market benchmark | Carrier performance deterioration, capacity tightness |
| Procurement output | Contract renewal trigger, mini-bid initiation | Backup carrier activation, spot buffer adjustment |
| Data recency requirement | Point-of-sale spot rates (not batched invoice data) | Real-time OTRI, not lagged carrier-reported data |
| Failure mode when inputs are wrong | Recommends rate adjustments that are already priced into the market | Misses rejection risk until after the load is turned back |
Data Prerequisites: What Your TMS Must Provide Before Models Can Run
Data readiness is the most frequently underestimated prerequisite in AI freight procurement deployments. Procurement teams often discover mid-deployment that their TMS data is incomplete, inconsistently structured, or too shallow in history to support reliable model training. Assessing this before vendor engagement — not after — is what separates deployments that deliver value from those that stall in the validation phase.
Minimum History Depth
The practitioner benchmark for reliable AI freight rate predictions is 18 months of lane-level shipment and tender data. Shorter history produces models that overfit to recent market conditions and fail to account for seasonal patterns. A model trained on 6 months of data from a soft freight market will systematically underestimate rejection risk when the market tightens — and vice versa.
This threshold is not arbitrary. Lane-level data that does not capture at least one full seasonal cycle generates recommendations that appear reasonable under current conditions and fail when those conditions shift. For lanes with strong seasonality — produce corridors, retail peak lanes, temperature-controlled freight — 24 months is a more defensible threshold.
Tender Record Quality Standards
History depth alone is insufficient if the underlying records are incomplete. For rejection modeling specifically, tender records must capture the outcome at the carrier level — not just whether a load moved, but which carrier accepted or rejected each tender, on which lane, and at what contracted rate. Many TMS configurations log tender events at the shipment level without preserving the carrier-level acceptance sequence. If your TMS cannot answer "Which carrier was tendered first on this lane on this date, and what did they do with it?", your rejection model has no usable training signal.
- Tender records must include carrier identity, lane, date, contracted rate at time of tender, and accept/reject outcome — not just final carrier assignment.
- Multi-stop and partial-load tenders must be flagged separately; mixing them with full-truckload tender data introduces noise into rejection models.
- Carrier-reported performance data (on-time delivery, damage rates) must be distinguished from independently verified performance data — models trained on carrier self-reporting produce systematically optimistic carrier rankings.
- Records must cover the full routing guide sequence, not just the first carrier tendered. Rejection cascades — where the second and third carriers also reject — are a distinct signal from single-carrier rejections.
Market Feed Integration Requirements
Rate prediction models require live market rate feeds, and the recency of that data matters significantly. Point-of-sale spot rate data — collected at the moment a load is covered or accepted by the carrier, not after invoice — provides the freshest available signal for benchmarking contracted rates against current market conditions. Batched invoice data, which is how many TMS systems ingest rate information, can lag the market by days or weeks. In a market moving as quickly as Q2 2026, that lag renders benchmarking recommendations stale before they reach the procurement team.
For rejection modeling, OTRI feed integration is the equivalent requirement. The index must be ingested at sufficient frequency — ideally daily — to capture the early deterioration in carrier acceptance rates that precedes routing guide stress. Weekly OTRI snapshots miss the signal window.
Lane Volume Thresholds
Both models require sufficient lane volume to produce statistically reliable predictions. Low-volume lanes — fewer than 20 to 30 shipments per month — typically lack the observation density needed for meaningful carrier-level rejection probability estimates. These lanes may still benefit from market benchmarking, but rejection modeling on thin lanes should be treated as directional rather than actionable until volume increases.
| Data Requirement | Rate Prediction Model | Tender Rejection Model | Minimum Standard |
|---|---|---|---|
| History depth | 18 months lane-level | 18 months carrier-level | 24 months for seasonal lanes |
| Tender record granularity | Lane + contracted rate | Carrier + lane + accept/reject outcome | Full routing guide sequence preferred |
| Market feed recency | Point-of-sale spot rates (daily) | OTRI feed (daily) | Batched/invoice data insufficient |
| Lane volume threshold | Reliable benchmarking possible at low volume | 20–30 shipments/month minimum for carrier-level predictions | Thin lanes: directional use only |
| Performance data source | Market rate indices | Independently verified carrier performance (not self-reported) | Carrier-reported data introduces bias |
The Four Procurement Signals AI Models Surface — and What to Do With Each
AI freight procurement models are most useful when their outputs are framed not as forecasts but as actionable signals that map directly to procurement decisions. There are four primary signal types, each of which should trigger a specific procurement response.
- Deteriorating carrier performance by lane. On-time delivery decline on a specific carrier-lane pairing that precedes routing guide stress. This signal appears in the data weeks before the carrier begins rejecting tenders. The procurement response is to initiate a mini-bid on that lane or activate a backup carrier before the rejection event occurs, not after.
- Contracted rates running above current market benchmarks. Lanes where your contracted rate has drifted above what spot or index-linked contracts would offer today. Traditional contracts built around annual bids create static pricing that can diverge from spot rates by significant margins. The procurement response is contract renewal or renegotiation on the flagged lanes, prioritized by the magnitude of the rate gap.
- Uncovered lanes with rising spot exposure. High-volume lanes without contracted coverage that are defaulting to spot pricing. As spot rates rise, this exposure compounds. The procurement response is coverage expansion — sourcing contracted capacity on lanes that have been left unprotected.
- Expiring contracts defaulting lanes to spot unnecessarily. Administrative lapses where contracts have expired without renewal, forcing lanes back to spot pricing even when contracted coverage would be available. The procurement response is proactive contract renewal triggered by expiration proximity, not by the operational disruption that follows lapse.
Each signal requires a different procurement action, which means each signal also requires a different governance response. Deteriorating carrier performance may warrant immediate action; an above-market rate on a low-volume lane may warrant monitoring. Defining the action threshold for each signal type is part of governance design, not something to determine in the moment.
TMS Integration Architecture: Native AI, Modular Overlay, or Standalone Agent
The integration architecture choice determines both how quickly a shipper can begin generating value from AI procurement models and how robust the data feedback loop will be over time. There are three viable paths, each with distinct tradeoffs.
Native AI
Intelligence embedded in the TMS from the ground up, with execution feedback loops built into the platform architecture. When a procurement action is taken — a mini-bid launched, a carrier contracted — the outcome flows back into the model's training data automatically. This creates the highest long-term data quality and the tightest signal-to-action loop. The tradeoff is that native AI requires either selecting a TMS that was built with this capability or migrating to one. For shippers with significant incumbent TMS investments, this path involves platform replacement costs and implementation timelines that make it a 12-to-24-month horizon decision, not a near-term deployment option.
Modular Overlay
An AI procurement agent added to an existing TMS via data ingestion and output push-back. The overlay reads lane history, tender records, and market feeds from the incumbent TMS, generates signals and recommendations, and pushes approved actions back into the TMS for execution. This path does not require rip-and-replace migration and is the most accessible entry point for shippers with established TMS investments.
The feedback loop quality depends on how cleanly the overlay can write execution outcomes back into the TMS data layer. If the push-back integration is shallow — if accepted contracts and carrier performance outcomes are not captured in a format the model can learn from — the feedback loop degrades over time and the model's accuracy improvement stalls.
Standalone Agent
An AI procurement module that operates independently of the TMS with its own data connections to market feeds, carrier networks, and shipper lane history. This is the fastest path to deployment — it does not require deep TMS integration — but it produces the weakest feedback loop. Execution outcomes that occur inside the TMS are not automatically visible to the standalone agent, which means the model's view of carrier performance and lane conditions can diverge from operational reality over time.
| Architecture | Speed to Value | Feedback Loop Quality | TMS Disruption | Best For |
|---|---|---|---|---|
| Native AI | Slowest (platform selection or migration required) | Highest — execution outcomes feed model automatically | High (platform replacement) | New TMS selections or shippers planning platform migration |
| Modular Overlay | Medium (integration project required) | Medium-high — depends on push-back integration depth | Low (no migration required) | Shippers with established TMS who want to add AI procurement without rip-and-replace |
| Standalone Agent | Fastest (minimal TMS integration) | Lowest — TMS execution outcomes not automatically captured | Minimal | Shippers who need immediate benchmarking and alerting capability; not suitable for autonomous action |
Governance Design: How to Phase Authority From Recommendations to Autonomy
Governance design is a deployment decision, not an afterthought. The authority level granted to an AI procurement model — what it can do without human approval — determines both the operational risk of the deployment and the conditions under which that risk is acceptable. Getting this wrong in either direction has consequences: too restrictive and the model adds overhead without reducing manual work; too permissive and errors propagate into executed contracts before anyone catches them.
There are three authority levels, and the progression between them must be earned through demonstrated model accuracy, not assumed from the outset.
Level 1: Recommendation-Only Mode
Every contract the model proposes is presented for human approval before it goes live. No action is auto-accepted. All model recommendations and the procurement team's responses to them are logged and auditable. This is the required entry point for any AI freight procurement deployment.
Recommendation-only mode serves two purposes beyond risk management. First, it allows the procurement team to calibrate their trust in the model by observing its recommendations against their own judgment before any of those recommendations have financial consequences. Second, it generates the approval-decision data that is itself a training signal — the model learns from which recommendations were accepted and which were overridden.
Level 2: Supervised Autonomy
The agent negotiates renewals and executes procurement actions within defined guardrails — rate bands, carrier eligibility criteria, lane volume limits — without requiring approval for each individual action. New carriers, expanded lanes, or actions outside the defined guardrails still require human review before execution.
The transition from Level 1 to Level 2 requires a defined accuracy threshold: what percentage of the model's Level 1 recommendations, when reviewed, were accepted without modification? A procurement team that is overriding 40% of recommendations is not ready to grant supervised autonomy. A team that is accepting 90% of recommendations with minor adjustments may be.
Level 3: Full Autonomy
Reserved for established lanes where model accuracy has been validated over multiple procurement cycles and the operational consequences of model errors are well-understood and bounded. Full autonomy does not mean unmonitored autonomy — audit logging, exception alerts, and periodic human review of autonomous decisions remain governance requirements at this level.

Phased Rollout Sequence: Rate Benchmarking, Then Rejection Alerting, Then Mini-Bid Automation
The sequence in which AI freight procurement capabilities are activated matters as much as the capabilities themselves. Deploying all three functions simultaneously — rate benchmarking, rejection alerting, and autonomous mini-bid — before any of them have been validated against live procurement decisions is how deployments generate noise instead of signal.
- Phase 1: Rate benchmarking against live market data. This is the lowest-risk starting point. The model compares your contracted rates against current market benchmarks and surfaces lanes where your rates have drifted above or below market. No procurement action is taken automatically — the output is a ranked list of lanes warranting review. This phase builds the data feedback loop, validates model accuracy against lanes the procurement team already knows well, and establishes the baseline metrics against which later phases will be measured. Governance mode: recommendation-only.
- Phase 2: Rejection alerting. Once Phase 1 has established model credibility and the data pipeline is confirmed to be producing reliable benchmarking outputs, add rejection alerting. The model begins surfacing carrier performance deterioration and lane-level rejection risk signals. Procurement teams review these alerts and decide whether to initiate backup carrier activation or mini-bid sourcing. No autonomous sourcing actions are taken. Governance mode: recommendation-only, with defined escalation thresholds for high-risk lanes.
- Phase 3: Autonomous mini-bid capability. Only after Phases 1 and 2 have demonstrated model reliability across at least one market cycle — ideally covering both a tightening and a softening period — should autonomous mini-bid capability be activated. At this stage the model can initiate competitive sourcing events on flagged lanes within defined guardrails, with human review required before contract execution on new carriers or expanded lanes. Governance mode: supervised autonomy on established lanes; recommendation-only for new carriers and lane expansions.
Success Metrics to Define Before Deployment Begins
Defining success metrics before deployment is not a formality. It is the mechanism by which the procurement team validates model output, justifies governance authority expansion, and defends the deployment investment to finance and operations stakeholders. Metrics defined after deployment tend to be selected to confirm what already happened rather than to test whether the model is working.
Four metrics must be baselined before any model goes live:
| Metric | What It Measures | Baseline Requirement | Phase Relevance |
|---|---|---|---|
| Routing guide compliance rate | Percentage of loads covered by contracted carriers at contracted rates without spot fallback | Current compliance rate across all lanes before AI activation | Phase 1, 2, 3 |
| Spot market exposure percentage | Percentage of total freight spend going through spot rather than contracted channels | Current spot exposure by lane and in aggregate | Phase 1, 2, 3 |
| Sourcing cycle time | Time from signal detection to executed contract or carrier commitment | Current average cycle time for mini-bid and contract renewal processes | Phase 3 (autonomous mini-bid) |
| Freight spend savings attribution | Cost reduction attributable to model-initiated benchmarking, renegotiation, or sourcing actions | Current contracted rate vs. market benchmark gap across the lane portfolio | Phase 1, 2, 3 |
On sourcing cycle time and freight spend savings: early deployments of AI freight procurement agents have reported up to a 75% reduction in sourcing cycle times and a 4.1% reduction in freight spend through continuous benchmarking and carrier competition. These figures reflect specific deployment conditions and should be treated as directional benchmarks, not guaranteed outcomes. The appropriate use of these numbers is to set the upper bound of what is achievable, not to commit to them as targets before the model has been validated against your specific lane portfolio.
Deployment Readiness Self-Assessment
Use the following checklist to assess your organization's readiness before engaging vendors or beginning deployment. Items marked as critical represent conditions that, if unmet, are likely to cause the deployment to stall or produce unreliable outputs. Items marked as required represent conditions that must be met before Phase 3 autonomous capability is activated, even if they are not blocking for Phase 1.
Data Depth and Quality
- 18+ months of lane-level shipment history is available and accessible from the TMS or data warehouse. (Critical — without this, rate prediction models cannot be reliably trained.)
- Tender records capture carrier identity, accept/reject outcome, and contracted rate at time of tender — not just final carrier assignment. (Critical — without carrier-level tender outcomes, rejection models have no usable training signal.)
- Carrier performance data is sourced from independent verification, not carrier self-reporting. (Required — carrier-reported on-time data introduces systematic bias into rejection models.)
- Market rate feed integration is in place using point-of-sale spot rate data, not batched invoice data. (Required before Phase 1 — batched data produces lagged benchmarks.)
- OTRI feed integration is in place at daily or near-daily frequency. (Required before Phase 2 — weekly OTRI snapshots miss the early rejection signal.)
- High-volume lanes (20+ shipments/month) have been identified and separated from thin lanes for model training purposes. (Required — thin-lane rejection predictions should be treated as directional, not actionable.)
Integration Architecture Readiness
- TMS data is accessible via API or structured export in a format the AI layer can ingest without manual transformation. (Critical — manual data extraction pipelines introduce latency and error.)
- The integration architecture choice (native AI, modular overlay, or standalone agent) has been selected based on TMS investment position and intended governance authority level. (Required before vendor engagement — architecture choice determines which vendors are viable.)
- For modular overlay deployments: the push-back integration path — how approved contract actions flow back into the TMS — has been defined and scoped. (Required — a shallow push-back integration degrades the feedback loop over time.)
- IT and procurement have aligned on data access permissions, specifically which TMS data fields the AI layer is authorized to read and write. (Required — permission gaps discovered mid-deployment cause project delays.)
Governance Design
- Recommendation-only mode has been confirmed as the entry governance level — no autonomous contract execution before model accuracy has been validated. (Critical — skipping this gate is the most common source of early deployment failures.)
- Approval workflows are defined: who reviews model recommendations, what information they receive, and what the expected response time is. (Required before Phase 1 — undefined approval workflows create bottlenecks that make recommendation-only mode slower than manual procurement.)
- Audit logging is in place: all model recommendations, human decisions, and executed actions are captured in a retrievable format. (Required — audit trails are a governance prerequisite, not a nice-to-have.)
- Authority escalation criteria have been defined: the specific accuracy thresholds and time conditions that must be met before progressing from Level 1 to Level 2 governance. (Required before Phase 2 — without defined criteria, authority expansion becomes a political decision rather than a data-driven one.)
- Task decomposition has been completed: freight procurement has been broken into distinct jobs (carrier selection, negotiation, compliance screening, onboarding) with different oversight requirements defined for each. (Required before Phase 3 — undifferentiated automation of the full procurement workflow makes failure modes untraceable.)
- The four success metrics — routing guide compliance rate, spot market exposure percentage, sourcing cycle time, and freight spend savings attribution — have been baselined using pre-deployment data. (Required before any phase — post-deployment comparisons are meaningless without a documented baseline.)
Comments
Join the discussion with an anonymous comment.